

Applications
Climate science detail
Climate Science Applications
(detailed)
The
major
culmination
of
ACRE
activities
is
the
20CR
reanalysis
system
conceived
and
run
by
the
Earth
Systems
Research
Laboratory
(CIRES,
University
of
Colorado)
with
the
support
of
the
Earth
System
Research
Laboratory
(ESRL,
of
NOAA).
Using
relatively
sparse
input
of
surface
pressure
data,
much
provided
and
facilitated
by
ACRE
and
its
partners,
the
system
recreates
a
rich
4D
global
dynamical
reconstruction
of
historical
weather
events.
Climate
scientists
can
use
this
output
to
analyse
in
detail
a
range
of
climate
phenomenon.
Below
is
a
representative
sample
of
this
research
work
made
possible
by
ACRE
and
20CR.
A
greater
range
of
scientific
research
that
relied
on
20CR
is
available
here
and
here
:
include all hotlinks
Land surface temperatures
Confirmation of global warming
Even
though
20CR
does
not
assimilate
surface
temperature
observations,
Compo
et
al.
(2013)
were
able
to
confirm
the
robustness
of
previous
conclusions
regarding
global
warming.
20CR
only
uses
synoptic
barometric
pressure,
monthly
sea
surface
temperature,
and
monthly
sea-
ice
concentration
to
reproduce
up
to
56
realisations
of
annual
variations
and
centennial
trends
in
the
land
air
temperature
data
sets.
It’s
output
confirming
global
warming
without
using
land
surface
temperature
records,
is
free
of
any
possible
inconsistencies
in
such
data
that
have
been proposed previously by climate change sceptics
Hemispheric to regional surface temperature variations
Yu
et
al.
(2014)
focused
on
decadal
modulations
of
Northern
Hemisphere
winter
land
surface
air
temperatures
and
atmospheric
circulation,
while
Richard
et
al.
(2012)
examined
mid
to
high
latitude
changes
in
Southern
Hemisphere
land
surface
air
temperatures.
More
regionally,
Soon
et
al.
(2011)
focused
on
variations
in
land
surface
air
temperatures
in
China,
Vose
et
al.
(2012)
examined
trends
in
US
land
surface
air
temperatures
using
observed
and
various
reanalyses,
while
Turco
et
al.
(2012)
looked
at
Spanish
instrumental
and
downscaled
20CR
output.
Precipitation
Regional
Zhang
et
al.
(2012)
focusing
on
southern
Africa,
used
8
global
reanalyses
to
study
African
monthly-mean
precipitation
and
compared
their
outputs
to
the
gridded
precipitation
dataset
from
the
Climate
Research
Unit
(CRU)
at
the
University
of
East
Anglia.
They
found
that:
“the
preferential
reanalysis
for
investigating
the
climate
variability
over
southern
Africa
is
20CRv2
that
furthermore
spans
the
longest
time
period,
hence
permitting
the
most
precise
investigations of interannual to decadal variability”.
Sub Regional
A
pilot
project
was
initiated
by
the
Met
Office
PRECIS
group
using
their
regional
climate
modelling
system
to
downscale
20CR
to
study
the
rainfall
associated
with
the
1894
River
Thames/Southern
England
flooding
event
(Brugge,
1994).
The
study
aimed
to
simulate
the
precipitation
drivers
of
the
1894
flooding
of
the
River
Thames.
It
demonstrated
that
the
downscaled
member
37
of
the
56
ensemble
member
output
from
20CR
provides
the
best
representation
of
the
precipitation
conditions
over
the
most
heavily
impacted
regions
of
the
UK.
As
noted
previously,
the
PRECIS
team
are
now
downscaling
20CR
to
provide
a
high
resolution
baseline
of
UK
droughts
from
1850-2014
under
the
MaRUIS
Project
(Managing
the
Risks, Impacts and Uncertainties of drought and water Scarcity)
Storms
20CR
contributed
to
the
analysis
of
an
1888
blizzard
and
a
1925
tornado
in
the
US,
and
storms
in
the
UK in both the 19th and 20th centuries.
Wave Heights
A
number
of
researchers
have
used
20CR
to
reanalyse
wave
heights
and
storm
surges.
They
came
to
the
conclusion
that
the
data
in
the
model
is
incomplete,
pointing
to
the
need
for
more
Old
World
data
recovery, digitisation and assimilation into 20CR model, activities championed by ACRE.
Heat Waves and cold spells
20CR
contributed
to
the
analyses
of
likely
causes
of
a
recent
heatwave
in
Russia
and
causes
of
ice
sheet
melting
in
Greenland.
Ouzeau
et
al.
(2011)
used
20CR
to
establish
the
uniqueness
of
the
European
cold
winter
of
2009-2010.
A
weather
regime
analysis
showed
that
the
frequency
of
the
negative
North
Atlantic
Oscillation
was
unprecedented
since
the
winter
of
1939–1940,
which
was
then
used
as
a
dynamical
analogue
of
the
winter
of
2009–2010
to
demonstrate
that
the
latter
might
have
been
much
colder
without
the
background
global
warming
observed
during
the
twentieth
century.
They
further
used
20CR
products
to
highlight
the
relevance
of
the
stratosphere
for
understanding,
if
not
predicting, such anomalous winter seasons.
Floods and Droughts
A
number
of
studies
have
used
20CR
to
analyse
historic
floods
and
droughts
in
Europe
and
North
America
up
to
150
years
ago.
They
also
examined
the
synoptic,
interannual,
decadal
and
multi-
decadal conditions underlying them.
El Niño Southern Oscillation
Studies
using
20CR
and
other
reanalyses
have
looked
to
improve
understanding
of
ENSO
dynamics.
They
re-examined
ENSO
events
to
determine
their
connection
with
other
climate
anomalies
including
ocean
winds,
sea
subsurface
temperatures,
SW
Pacific
rainfall
and
global
drought.
A
study
of
the
1877-1878
El
Niño,
and
the
conditions
leading
up
to
and
following
it,
using
20CR
is
in
under
development.
Global warming hiatus
In
a
draft
of
work
led
by
Li
Qingxiang
(China
Met.
Admin.,
Beijing),
a
comparison
was
made
between
surface
air
temperature
trends
from
20CR
and
observed
trends
over
China.
For
1961-2012,
20CR
produced
year-round
warming,
as
observed.
For
the
global
warming
“hiatus”
period
1998-2012,
20CR
reproduced
cooling
over
China
in
winter,
in
agreement
with
observations,
with
little
change
in
summer.
As
20CR
does
not
use
air
temperature
data
or
aerosol
forcings,
it
was
concluded
that
the
winter
cooling
must
have
come
from
the
atmospheric
circulation,
i.e.
an
increase
in
winds
from
the
north
responding to the assimilated atmospheric pressure data.
Other Historical events
Tambora Eruption and the ‘Year without a Summer’ (1815-1817) Reaching very far back into climate
history, this is a reanalysis of the period around the Tambora volcanic eruption using 20CRv2c, but
with climatological SST and sea-ice, and no stratospheric aerosols.
Imperial Trans-Antarctic Expedition (1914–17) The Imperial Trans-Antarctic Expedition led by Sir
Ernest Shackleton, failed to reach its exploration objectives, but it did allow groups of scientists to
spend many months in the Antarctic, where they made careful observations of the weather. Though
the expedition records have not been published or systematically analysed, they provide the data
required for a reanalysis of the Antarctic weather 1914-1916.
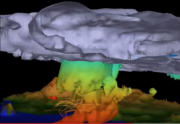
“Climate scientists can
use this output to analyse
in detail a range of climate
phenomenon.”
“..used 8 global reanalyses
to study African monthly-
mean precipitation”
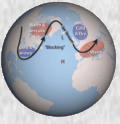
“…the frequency of the
negative North Atlantic
Oscillation was
unprecedented since the
winter of 1939–1940”
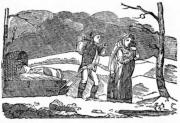
“Reaching very far back
into climate history…”